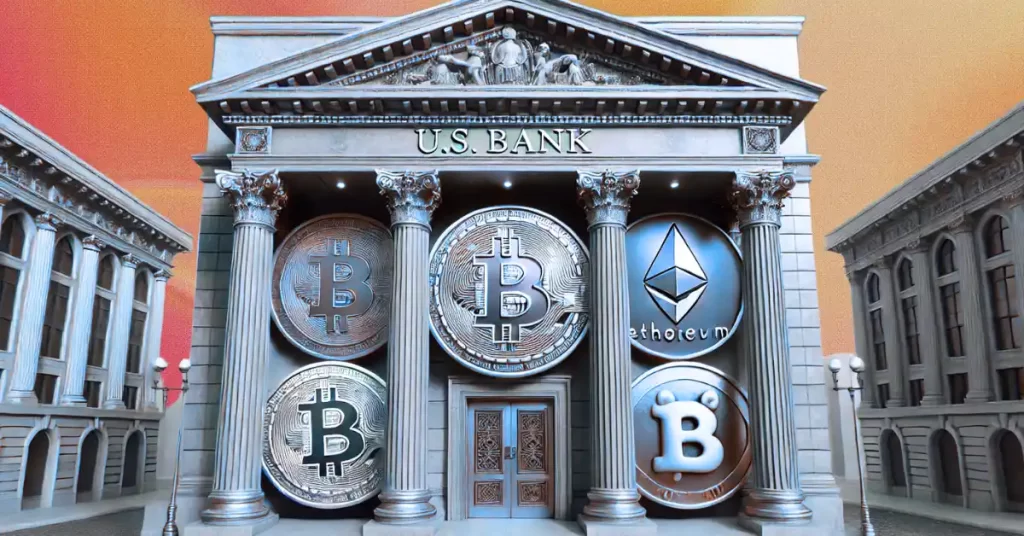
The cryptocurrency market has been trading sideways in recent weeks, with the leading token, Bitcoin, following a similar pattern. Despite numerous attempts in April, Bitcoin has struggled to break the $31,000 mark. The price is blocked by its daily Kijun at around $29,100 and by its psychological resistance at $30,000. A correction to around $25,000 could be preferred to prepare for an extended bull run as long as this zone blocks prices. This would correspond to a retest of the same resistance level at the beginning of the year and can be confirmed as the support level. In the event of a break through the $31,000 mark, then Bitcoin could continue to climb towards $33,500. This would provide the next resistance level ahead of a potential ascent to $40,000. However, if the bears persist below $25.000, Bitcoin risks breaking the price spread, which could cause the price to fall below the $18,000 mark. Related reading: Polygon Bears Gain Ground As MATIC Continues To Retreat Bullish Sentiment Based On External Factors Bitcoin is in good stead and could make a major bull run due to the following factors. First, the banking crisis is plaguing the United States and other parts of the world. Secondly, there is the decoupling between BTC and traditional markets. Finally, we can mention the brake on interest rates the US Federal Reserve promised. The Silicon Valley Bank bankruptcy in early March is still wreaking havoc on the industry, with many Americans scared of placing their money in the Bank. Bitcoin’s recent price surge has coincided with this, showing its flexibility as digital gold. Related reading: UMA Token Surges By 28% Despite General Bearish Trend There has been a surge among investors to diversify their assets into Bitcoin for good reasons. Bitcoin does not need intermediaries; anyone can store BTC in their wallets without trusting a centralized institution. Bitcoin is a unique asset due to its volatility. At times it shows a high correlation with stock indices. While sometimes, it diverges and forms its own course. The following graph shows the comparison with respect to gold, the S&P500, and the NASDAQ. Pearson’s correlation shows how close BTC’s behavior is to that of certain traditional assets. If the shares of banking and fintech companies continue to fall, there’s likely to be a huge inflow of volume into the Bitcoin network leading to a price surge. Finally, the Fed raised interest rates to 5.25% annually. This is the maximum level since 1997. But the increase came with an extra announcement: no new increases (or reductions) are foreseen for the remainder of 2023. Generally, a stalemate or reduction of interest rates is a catalyst for the increase in the price of risky assets, such as Bitcoin. Bitcoin Price At the time of writing, Bitcoin is down 2% in the past 24 hours and trading for $28,826. -Featured image iStock, charts from Tradingview


